

Risk of ruin is the probability your trading bankroll hits a defined "broke" level before it grows, given your win rate, payoff (edge), volatility, and position size. To act on it, pick a ruin threshold, estimate your edge, then apply a risk of ruin formula (or a risk of ruin calculator) and adjust sizing until the probability is acceptable.
Core Concepts Behind Risk of Ruin
- Ruin is a threshold: it can mean absolute zero, margin call, or a drawdown level where you stop trading.
- Edge is not enough: positive expectancy can still go broke if bet size is too large for the variance.
- Position sizing drives outcomes: the same strategy can be "safe" or "fragile" depending on risk per trade.
- Variance is the hidden lever: streaks and payoff dispersion dominate short-to-medium horizons.
- Model assumptions matter: independence, stable win rate, and stable payoff rarely hold perfectly in live markets.
What Risk of Ruin Actually Measures and Why It Matters
Risk of ruin answers a practical question: "If I keep trading this way, what are my chances of hitting my stop-trading point before I recover?" In leveraged products common in Thailand (including CFDs and spot-style platforms), "ruin" is often forced by margin rules, not by a trader choosing to quit.
It is not the same as "expected return." A system can have a positive average outcome but still have an unacceptably high chance of hitting the ruin threshold due to volatility, bad streaks, or oversized positions.
Use it for decisions you can control: defining a maximum acceptable probability of failure, setting risk of ruin position sizing, and stress-testing what happens when win rate or payoff temporarily deteriorates.
Mathematical Foundations: Models and Core Formulas
Most risk-of-ruin methods approximate trading as repeated bets with uncertain outcomes. You do not need deep theory; you need a model that matches your trade outcomes well enough to size safely.
- Choose a ruin threshold: equity level R where you stop (e.g., 60% of initial) or where margin forces liquidation.
- Define bankroll: starting equity B you will allocate to this strategy.
- Pick an outcome model: (a) win/lose with fixed payoff, (b) variable payoff with mean and variance, or (c) empirical distribution from your trade log.
- Minimal "win/lose" risk of ruin formula (common approximation): if each trade risks a fixed amount and outcomes are independent, ruin probability decreases rapidly as the ratio B / risk-per-trade increases, and increases as payoff volatility increases.
- Practical translation: you reduce ruin by lowering risk per trade, improving payoff asymmetry, or increasing the distance between current equity and the ruin threshold.
- Reality check: correlation (clustered losses), regime changes, and widening spreads increase real ruin probability versus a clean model.
| Concept | What it answers | What you can change |
|---|---|---|
| Risk of Ruin | Chance of hitting a "stop-trading" equity level | Ruin threshold, position size, leverage, trade frequency |
| Max Drawdown | Worst peak-to-trough decline observed or simulated | Mostly affected by sizing and strategy volatility |
| Expectancy | Average profit per trade | Entry/exit rules, costs, payoff structure |
Input Parameters: Win Rate, Edge, Variance and Bet Sizing

Before you calculate, clarify what you will plug in. For intermediate traders, the biggest mistake is mixing a "backtest win rate" with a different live payoff distribution (slippage, spreads, partial fills).
- FX/CFD swing trading: risk of ruin forex is often driven by gaps, rollover, and volatility spikes; model variable outcomes, not a fixed R multiple.
- High-frequency or scalping: small average edge, high trade count; costs and spread widening can flip expectancy and inflate ruin risk.
- Martingale/anti-martingale variants: sizing is path-dependent; standard fixed-bet formulas understate risk-use an equity-curve simulation from rules.
- Portfolio of strategies: correlation matters; two "independent" systems that lose together can double effective variance.
- Prop-style rules or personal stop rules: ruin threshold is not zero; it's the point where you must stop due to limits (daily loss, max drawdown).
Rule of thumb for inputs: use conservative (worse) win rate and payoff than your best backtest, and include realistic costs for your Thailand broker conditions (spreads/commission/slippage).
Step-by-Step Calculation with a Numerical Example
Below is a simple, actionable workflow to calculate risk of ruin trading without overfitting. The goal is not a "perfect" probability; it is to find sizing that keeps ruin risk within your tolerance under reasonable pessimistic assumptions.
- Define: starting bankroll B = 100,000 THB. Ruin threshold R = 60,000 THB (you stop if down 40%).
- Set position risk: risk per trade r = 1,000 THB (1% of initial).
- Estimate outcomes: win rate p = 0.45. Average win +1.8R. Average loss -1.0R (R is the amount risked).
- Compute expectancy per trade (in R): E = p × 1.8 − (1 − p) × 1.0 = 0.45×1.8 − 0.55×1.0 = 0.26R.
- Translate to money: expected profit per trade ≈ 0.26 × 1,000 = 260 THB (before considering changing volatility, fat tails, and costs).
- Approximate "distance to ruin" in losses: you can lose (B − R)/r = (100,000 − 60,000)/1,000 = 40 full-risk units before stopping.
- Use a tool to convert this into probability: plug B, R, r, p, and payoff (1.8R / 1.0R) into a risk of ruin calculator, or run a Monte Carlo simulation from your trade outcomes.
- What this example is good for: checking whether your risk per trade is obviously too large relative to your stop threshold, and comparing "1% vs 0.5% risk" scenarios consistently.
- Where it breaks: if your losses can exceed 1R (gaps), if trades are correlated (loss clusters), or if your win rate/payoff changes by regime, the true ruin probability will be higher than the clean estimate.
Practical Ways to Reduce Your Risk of Ruin
- Reduce risk per trade first: if you are uncomfortable with the result, lowering r is the fastest lever (and often the only reliable one).
- Stop using "best-month" inputs: optimistic win rate and payoff estimates are the main reason traders underestimate ruin.
- Do not confuse leverage with edge: leverage magnifies variance; it does not improve the strategy's expectancy.
- Avoid path-dependent sizing without simulation: doubling after losses can look safe in a fixed-bet formula but explode under realistic streaks and costs.
- Respect liquidity and spread regimes: if your system relies on tight spreads, model the worse conditions you actually see during news/illiquid sessions.
Actionable target: choose a maximum acceptable ruin probability, then back into a smaller r until your estimate (and a pessimistic stress test) fits.
Implementing Risk Controls: Position Sizing, Limits and Monitoring
Turn the number into daily behavior. The point is to prevent "silent drift" where costs rise, your edge shrinks, and your original risk-of-ruin sizing no longer applies.
Mini playbook you can apply immediately

- Hard-stop definition: set the ruin threshold (equity or drawdown) where you must stop and review.
- Sizing rule: compute position size from a fixed money risk per trade (or a small % of equity), not from "how confident you feel."
- Guardrails: daily loss limit and weekly loss limit that trigger a pause.
- Monitoring cadence: re-estimate win rate and average win/loss on a rolling sample; if it deteriorates, cut risk per trade automatically.
Simple pseudo-logic for a sizing gate
Inputs: B (equity), R (ruin threshold), r_base (planned risk/trade),
        p_est (conservative win rate), payoff_est (conservative avg win in R)

If B <= R: stop trading (review)
If last_20_trades_expectancy < 0: r = r_base * 0.5
Else: r = r_base

If (B - R) / r < minimum_loss_units_buffer: r = r * 0.5
Place trades only if r is within your pre-set maximum % of equity
Practical sizing takeaway: treat risk of ruin position sizing as a gate-if conditions worsen, size down first, analyze second.
Practical Clarifications and Short Answers
Is a risk of ruin calculator reliable for live trading?
It is reliable only to the extent that your inputs match live conditions (costs, slippage, payoff variability). Use it as a sizing guide and add pessimistic assumptions to reduce model risk.
What is the simplest risk of ruin formula I can use?
The simplest approach models trades as repeated bets with a win probability and win/loss payoff, then estimates the chance of reaching a ruin threshold before recovery. If your payoffs vary a lot, a Monte Carlo simulation from your trade log is usually more appropriate than a single closed-form formula.
How do I calculate risk of ruin trading if my R-multiples vary?
Export your trades, build an empirical distribution of R outcomes (including costs), and run Monte Carlo paths to see how often equity touches your ruin threshold. This captures fat tails better than a fixed win/loss model.
Does risk of ruin forex differ from stocks or crypto?
The concept is the same, but FX/CFDs often have higher leverage and margin constraints, so "ruin" is frequently a forced liquidation level. That makes threshold selection and worst-case loss modeling more important.
What matters more: win rate or payoff ratio?
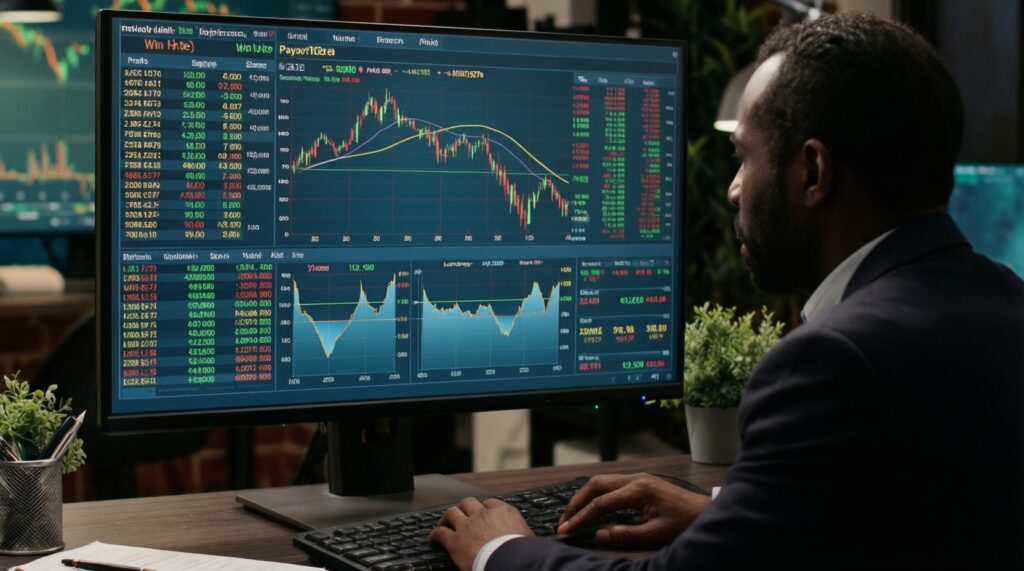
Both: a higher payoff ratio can compensate for a lower win rate, but it can also increase variance if outcomes are less stable. Always evaluate them together with position size and drawdown limits.
How often should I revisit my inputs?
Update whenever costs change, volatility regime changes, or your rolling sample of trades shows meaningful drift in win rate or average win/loss. If you cannot monitor reliably, size more conservatively by default.